Thursday, May 26, 2016

Manage Risk with Position Sizing

Position sizing should be part of your overall investment strategy regardless of what style of investing you use.  It is intended to control downside risk.  There are certain rules you should follow but like most things with stock investing you do have to customize the process to fit your personal needs and risk profile..

How much you buy in a single trade—or your position size—is a critical decision. It directly impacts how much you might gain or lose on a trade and is another key part of the risk equation. Position size is influenced by two important concepts: portfolio risk and total amount invested.

Portfolio risk is the target maximum amount of money you’d lose on a single trade if the trade hit your stop, or was “stopped out.”  Most investors with a “Low” appetite for risk should settle in on .5%, moderate risk 1% and aggressive should keep it 2% or less.  If you are just getting started with investing I’d recommend the 1/2 percent level until you get familiar with how the sizing works and impacts your overall portfolio.

Investors also need to consider the total amount invested in any one trade. Consider setting a guideline to allocate no more than 10% of your portfolio to one investment. You may want to scale down if you’re more conservative or new to investing.

To figure this all out you need to determine the Trade Risk of the stock you are ready to purchase.  Trade risk is the stocks purchase price minus the stop price.

Stop Price has no right or wrong answer when calculating.  It is your decision to make at the time of the purchase when you get out of a stock that is turning against you.  One good method is to look at current support levels on the chart and set a stop price.  (Low risk appetite set just below support, average risk about 3% below that and more aggressive set about 5% below support. 

Here’s an example of a stock XYZ selling for 55.69. 

image

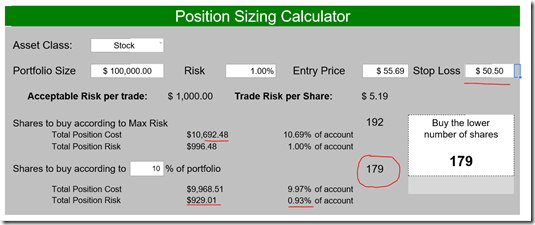
Some might see support at 53 while others may call support at 50.50.  Neither is wrong and will end up carrying the same risk in dollars.  The trade risk on the 53 stop is 55.69-53=2.69  while the trade risk on the 50.50 stop is 55.69-50.50=5.19

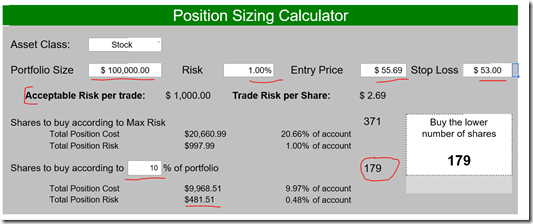
In the below example, notice that the acceptable risk per transaction is 1000 dollars so with the tighter stop you can purchase 371 shares but need to get out if stock goes down to 53.  Also notice that since you don’t want to exceed 10 percent of the portfolio you need to reduce your purchase from 371 down to 179 to stay under 10,000 dollars.  This also reduces your risk exposure down to 481 dollars if you have to exit at 53.

image

Higher trade risk below equals less shares per max risk (192 vs 371 above) but shares to actually buy remains the same at 179 due to 10% allocation rule.

image

Lastly, Here is a google spreadsheet for you to use to make your own calculations if you decide you like this concept and want to incorporate it into your trading rules.

Google Sheets Position Sizing Calculator

I did put edit rights on this share but if you plan to use it you should save a copy of it to your google sheets for your personal use.

Sunday, May 22, 2016

A Look at Stock Rover

Alex Reisman of Stock Rover gives an overview of the online stock research platform.

At a glance:

  • Online stock research software
  • Screening, stock comparison & portfolio analysis
  • Link to brokerage for automatic portfolio syncing
  • Free & paid membership plans

Stock Rover is an interactive “dashboard” where you can engage in robust stock research. Stock Rover’s goal is to help individual investors make informed, independent decisions and to support them in their investing goals.

There are two membership levels: Basic (free) and Premium ($249.99/year or $74.99/quarter). Both levels provide detailed data on North American tickers, using the same integrated, comparison-oriented format. The major advantages that Premium offers over Basic are more financial metrics, 10 years of historical data rather than five, data export to offline CSV files, more flexible screening, deeper portfolio analysis, portfolio planning tools, and an ad-free environment. A 14-day free trial of Premium is available to all users (no payment information is needed; learn how to start the trial here).

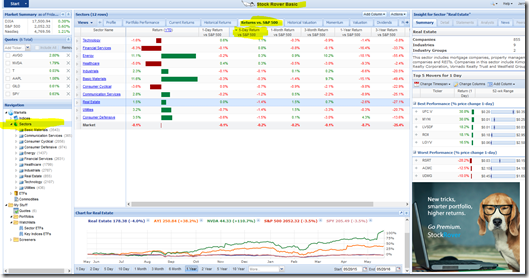
Once you register for the FREE version and sign in you will go to a Summary page.  Look for an Orange button in the upper right corner of the page that says : “Launch SR” and click on that.  This will take you to the Stock Rover Basic application shown in the screen shot below.

image

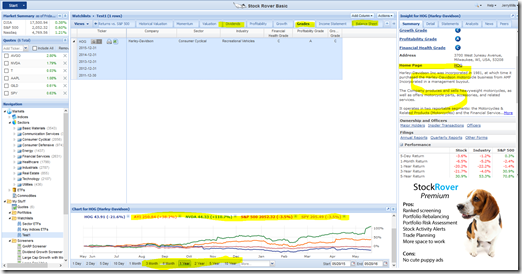
The above screen shot is showing where the strong sectors of the overall S&P is right now.  You can sort by any of the columns.  Day traders want to see what's strong now.  Swing traders might want to see what’s strong over the past 5 days while trend traders or intermediate traders might look at the past month for strength.  Then you can drill down into the sectors to show what industries are strongest then drill into the industries for a list of stocks in that industry to see what particular companies are the strongest.  Once you select a company details of the stock show up using the tabs, side bar and comparisons highlighted in the screen shot below.

image

Good site well worth the time to register and learn how to use…

Thursday, May 19, 2016

Why Starting Young with Long Term Strategy Pays Off

Stocks That Raise Their Dividends Greatly Outperform

Academic and industry studies confirm that quality dividend payouts lead to strong future returns. That’s a mouthful to be sure, but what it distills down to is that as an investor, dividends allow you to have your cake and eat it too! Dividends provide you with a valuable income stream, plus they can play an important role in helping you focus in on stocks that have the ability to produce staggering share price growth.

In order to appreciate the predictive power of dividends, consider a recent study conducted by Ned Davis Research and Oppenheimer Funds (see Figure 1 below).

The study looked at the average annualized returns for S&P 500 stocks from 1972 to 2014. As you can see, during this impressive 42-year study, stocks with Rising Dividends greatly outpaced the stocks that cut their dividends or simply did not offer a dividend in the first place. Further, if you focused on investing in Rising Dividend Stocks over fixed dividend stocks, you would have received 32% more return each and every year of the 42-year study.

(above is from AAII)

Tuesday, May 10, 2016

Barrons Review of iViewMarkets

Top Websites for Quantitative Stock Analysis


IVIEWMARKETS (iviewmarkets.com) is a similar market-analytics Website, but it focuses on data-gathering. It provides real-time market information and tools to rate the prospects of 10,000 U.S.-listed stocks and funds. But, instead of the proprietary factors used by Chaikin, iVIEWMarkets, a just-launched free site, employs off-the-shelf technical and fundamental measures. The company was started by Brett Golden, its president, who also founded the paid site ChartLabPRO (chartlabpro.com), which features its own proprietary tools.
Like Chaikin Analytics, the graphical nature of the site helps visitors follow its often-overwhelming data stream. Charts, heat maps, and gauges facilitate quick interpretation of popular internal market indicators and individual security metrics.
Complementary indicators are grouped together into views outfitted with just the tools and data appropriate to them. For example, the Trader View mixes the week’s best- and worst-performing Standard & Poor’s 500 members, overbought and oversold securities, and the relative performance of the week’s best industries.
These kinds of market triggers often find their way into trading algorithms. But iVIEWMarkets doesn’t offer the kind of algorithm-building platform found on social quant sites, such as Quantopian (quantopian.com). Its focus is to identify and deliver key market data—in real time.
During the recent market slaughter, iVIEWMarkets e-mails delivered changing support and resistance levels for all securities in subscriber portfolios daily. Chartists with a better-than-average knowledge of technical analysis can figure these out. But think of the time saved by having a dozen or more of these key entry and exit inputs recalculated for you every day.
Time is always of the essence. And for traders, not just any knowledge, but rather actionable information, is power.


Google+