Showing posts with label Fundamental Analysis. Show all posts

Sunday, October 8, 2017

A Look at Stock Rover

Stock Rover is as close to an all-in-one stop for stock information that I have seen. It has 2 separate sections that I refer to as the "Market" section and the "Stock Rover App" section. Both of these sections have a vast amount of useful underlying research information on the various stocks that make up the tradable stocks on the exchange. I will not be able to detail all of what you will find on this site. Just highlighting the areas that I find interesting will make for a long enough post. I can't stress enough that there is a ton of information under each tab and many more when hovering over some items or right clicking things like symbols.

You must register with Stock Rover. The registering is free and will give you access to everything I am talking about here. Premium membership is $250 per year. I don't think the Premium is necessary for most investors, especially smaller investors trying to learn. If you want to though they do have a 14 day free trial that you activate from the Stock Rover app menu with no credit card information required for the free trial. If you don't upgrade in the 14 days the app returns to the "free" version. Do not take this as an advertisement or recommendation, I have no affiliation and get no benefit from anyone subscribing.

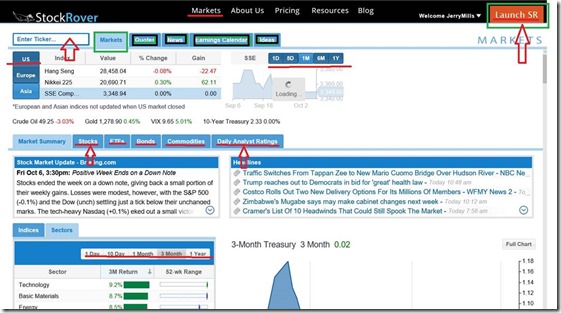
Image 1 below is the main Markets page. I've highlighted a few things on here. Black menu bar at top is main sections and this shot is on Markets. On the Market section there is a lot to see. Notice the first set of tabs. It also is on Markets showing the performance of the overall indexes. Note that you can change the time frame to get up to one year performance. This tab also provides a lower table which is currently on Market Summary showing yet another table below that which is currently on Sectors. You can also change the time frame on sectors to get various views on strong sectors for whatever period you select. If you trade on the uptrends you want to use this to find which sectors are the best then drilling down into them to see what stocks are strong.

Notice the tabs along this table. In addition to Market Summary you have a Stocks, ETFs, Bonds, Commodities and Daily Analyst Ratings. Each of them has a summary for that day. Stock tab will show the largest movers for the day and top performers and top losers. Also note, the daily analyst tab shows companies that have been upgraded or downgraded for that day.

Image 1
clip_image002

Image 2 shows the screen that you get when staying on the Markets section (top black menu) but moving the first table down to "Quotes". Here, if you have no tickers entered you need to have one. This shot is looking at Oracle (ORCL). Note the table right under that is currently on Financials but you have a Details, Chart, News, and Peers in addition. I just wanted to highlight the Financials so you could see the fundamental data available here. By clicking the + mark in each line reveals the data for that item. It is currently on Financial Health. Note the data and graphs. On the left side if you click on the existing "X" it will remove that item from the graph. Clicking on the graph icon will add the item. You can have up to 4 items in the graph.

Image 2

clip_image004

In Image 3 we again stay in the Markets section (Black menu bar at top) but in the first table we clicked on "Ideas". Stock Rover keeps a few "featured screeners" to run without having to go into the Stock Rover app (image 4 below) I just want to point out that in the image below sitting just below the list of screened stocks is "Other Featured Screeners" Click on one of them for a different type of screen. The active screen shows the details of what is being screened to the left of the list of stocks. Also not you can access he CNBC Video Feed (Lower Right of Image 3)

Image 3

clip_image006

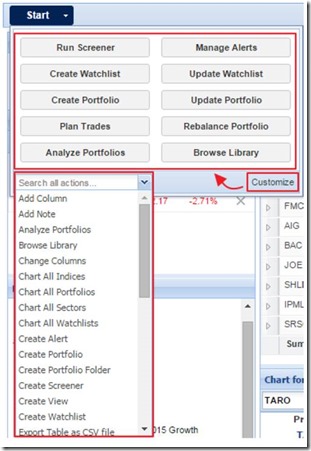
Lastly is Image 4 below which is the Stock Rover App. If you look on the images above it is located on the black menu bar at the top on the far right. Click the orange button "Launch SR" and it should open this up in a new tab or window depending on how you have your browser setting. This has just as many different places to explore as the "Markets" page so I won't try to get into too much detail here. I just want to highlight a few things. See the Start button (upper left of image 4)? Clicking that down arrow brings up a menu shown in Image 5 below. Look over the sections on this page. On the left side is the Market Summary, Quotes and Navigation. You simply have to click on the areas that I have highlighted in the Navigation section to see how really intensive this section is. As you highlight any of the stocks in the table in the middle (Research Tickers) It will populate the bottom chart and the right section labeled Insight for (symbol). Notice the grading system I highlighted in that box. Also note the tabs for additional details.

Image 4

clip_image008

Image 5 - Clicking arrow next to "Start" this is under the start menu
clip_image010

So this post just touches on the many features of this well laid out stock research website. I strongly recommend you spend a little time clicking through things here. As you click around in here you will probably come across some of the features only available to premium members but as of now it has not compelled me personally to pay for it. For me, I have another stock screening app that I am presently paying for that runs out in January of next year. At that time I might consider trying the premium. Lastly, below is a few links for more information about Stock Rover.

Compare features of Free vs Premium

https://www.stockrover.com/plans/compare/

Detailed Help for Stock Rover app (not Markets page)

https://www.stockrover.com/how-to/stock-rover-basics/right-click-menus/

17 page Getting Started Guide in PDF format for the Stock Rover app (not Markets page)

https://www.stockrover.com/library/pdf/getting-started-in-stock-rover.pdf

Created with Microsoft OneNote 2016.

Sunday, August 14, 2016

3 Items to look for in a Stock

This is an excerpt from an article on Motley Fool regarding Google stock but the 3 items in the list below are valid and can be used when looking for very strong companies.  I have not worked out a stock screen yet to see if I can incorporate these 3 items into a screen but will be looking to do so.  I especially need to look at item 3 below to better understand what that means.

The Motley Fool | 2016-08-13T18:04:00Z

No book has had a more profound impact on my investing than Nassim Taleb's Anti fragile. It argues that the entire world can be broken into three categories:
  • The Fragile: things that break as soon as stress is applied -- like a glass falling off of a table.
  • The Robust: things that stay absolutely the same under stress -- a rubber ball falling from the same table.
  • The Anti fragile:things that become more powerful when stressors are introduced -- think of how your bone heals back stronger than before after it's broken.
We want our portfolios to be as anti fragile as possible. But we often fail at this. That's largely because we are suckers for the narrative bias: We tell ourselves a story about a company: how its sales will grow and its products will revolutionize the world, and we invest accordingly.
I created a compelling narrative for the first stock I ever wrote about for The Fool six years ago. Since then, that stock has trailed the market by a whopping 172 percentage points!
By viewing the investing world through an "anti fragile" lens, I eliminate the narrative bias by focusing on three attributes:
  1. Lots of cash and lots of customers: cash gives companies options during downturns -- outspending rivals, buying back stock, or acquisitions. Debt does the opposite. And by having lots of customers, a company doesn't run the risk of losing an outsized portion of business if a client walks away.
  2. Management with skin in the game: When the people running the company have their own skin in the game -- via shares of the company's stock -- their long-term interests are aligned with ours. That benefit compounds when founders are running the company, as they often view it as a literal extension of themselves.
  3. A barbell approach:This means having two sides to your strategy -- on one hand you have a business segment that has a wide moat. On the other hand, you take lots of low-probability, low-risk, high-reward bets -- a trait otherwise known as "optionality".

Wednesday, June 8, 2016

CEF Distributions

Except for a handful of exceptions, CEFs themselves do not pay taxes.

Instead, like open-end mutual funds and ETFs, CEFs pass the tax consequences of their investments onto their shareholders.

To maintain tax-free status, a CEF must pass onto shareholders, generally speaking, roughly:

  • 90% or more of net investment income from dividends and interest payments
  • 98% or more of net realized capital gains

Investors should be aware of the source of their distributions.

CEF distributions have four potential sources:

1. Interest payments on fixed-income portfolio holdings

2. Dividends from equity holdings

3. Realized capital gains

4. Return of capital:

  • Pass-through (from master limited partnership investments, primarily)
  • Constructive (from unrealized capital gains)
  • Destructive (investors are literally receiving their own capital, minus expenses)

For accounting and tax purposes, distributions must be linked back to the initial source: usually dividends, income, and/or realized capital gains. These are actual cash inflows into the fund.

When the distribution exceeds the cash generated from these sources, the fund must ascribe the initial source as a return of capital.

Throughout the calendar year, funds estimate the breakdown of their distributions. Shareholders receive a Form 1099-DIV in January with the actual distribution breakdown for the prior year for tax purposes. Any previous information regarding the categorization of distributions are only estimates.

Prospective investors are at a disadvantage because they do not have access to the tax forms. They must wait until the fund files its annual statement to see the finalized distribution breakdowns in order to discern its use (if any) of return of capital.

Morningstar.com displays a fund's most recent distributions, along with their sources, as well as distributions for the four previous calendar years.

image

I chose ETV as an example screen shot from Morningstar as it shows all the types of distributions being used.  Return on Capital is a red flag for me as it can be very destructive to the fund if you do not know which type of ROC is being used (Pass thru, Constructive or Destructive)  I tend to make a worse case assumption when I see ROC is being used.  In this case I looked at the NAV history over 2 years and it appears ETV is not using the destructive exclusively but I think in some months it is being used.  The NAV in January 2014 was $14.53 and in July 2014 the NAV exceeded $15.  But in January 2016 NAV was $13.39.  I would not be interested in this CEF for a couple of reasons.  One is I don’t trust the ROC distributions and the other reason is that it is selling for $14.84 with a NAV of $14.02.  This is a 5% premium which in effect has you paying $1.05 for $1.00 of asset.

The takeaway from this is that when looking at CEF’s it is important to look at the distribution  and understand how it is being paid.  It is one of the several things that need to be evaluated in a different light then regular stocks are looked at.

Tuesday, June 7, 2016

CEF’s Relative Premiums & Discounts

In truth, all discounts and premiums are relative to another number. Absolute discounts/premiums are relative to the net asset value (NAV). Relative discounts/premiums are relative to the average discount of the particular CEF being considered.

Because absolute discounts and absolute premiums tend to persist, relative discounts and relative premiums matter.

Academic studies have shown that current discounts/premiums converge to their average discounts/premiums much more regularly than they converge to their NAVs.

Measuring Relative Discounts/Premiums

  • To measure relative discounts, we use a z-score:
    z = (current discount – average discount) / standard deviation of the discount
  • A negative z-score indicates that the current discount is lower than its average.
  • A positive z-score indicates that the current premium is higher than average.

In our opinion, a z-score of less than -2 signals that a fund is relatively inexpensive, and a z-score greater than +2 signals that a fund is relatively expensive.

Example 1

  • Current discount = -8%
  • Average 1-year discount = -15%
  • 1-year standard deviation of discount/premium = 2
  • z-score = (-8 - -15) ÷2 = (-8 + 15) ÷ 2 = 7 ÷2 = 3.5

With a z-score of 3.5, this fund would be considered relatively expensive. But this doesn't necessarily mean that the CEF is overvalued.

Example 2

  • Current discount = -15%
  • Average 1-year discount = -10%
  • 1-year standard deviation of discount/premium = 2
  • z-score = (-15 - -10) ÷2 = (-15 + 10) ÷ 2 = -5 ÷2 = -2.5

With a z-score of –2.5, this fund would be considered relatively inexpensive. But this doesn't necessarily mean that the CEF is undervalued.

Why Are Relative Discounts Helpful?

For one, they can help you avoid value traps.

Let's look at the mythical CEF trading at a 15% discount. According to the oft-cited "CEF wisdom," this would be a good trade because the market is offering investors $1.00 of assets at the bargain price of $0.85. (Forget the fact that the $1.00 worth of assets may fall in value to $0.85!)

Consider this:

  • 3-year average absolute discount = -25%.
  • Current absolute discount = -15%
  • Standard deviation over the certain time period = 2
  • z-score = (-15 - -25) ÷ 2 = (-15 + 25) ÷ 2 = 10 ÷ 2 = +5.

A z-score of +5 indicates that, far from being relatively inexpensive--as CEF wisdom would have it--this CEF is relatively expensive. It could represent a classic value trap.

Z-score can also help investors uncover potentially truly undervalued and overvalued CEFs. If the z-score is greater than +2 or less than -2, more research would be warranted.

Using relative discounts/premiums is a bit of an art. The time period analyzed is a large factor in the z-score.

The same CEF may look relatively expensive on a 6-week basis and relatively cheap on a 3-year basis.

Even though the CEF may look relatively expensive or relatively cheap, it may not be truly overvalued or undervalued.

Consider a CEF that is going to liquidate in one month. Liquidation is a method of making a CEF's share price converge with its NAV. All assets are sold and the remaining capital is distributed to shareholders. At the point of liquidation, the discount will be 0.

  • Current discount = -2% (in anticipation of the pending liquidation)
  • 1-year average discount = -12%
  • 1-year standard deviation = 1.5
  • z-score = (-2 - -12) ÷ 1.5 = (-2 + 12) ÷ 1.5 = 10 ÷ 1.5 = +6.7
  • This CEF is relatively expensive, but with very good reason: A corporate action has narrowed the discount. If an investor attempted a short sale of this CEF in the market, the likely outcome would be a capital loss.
There could be a fundamental reason behind a high or low z-score. Do not buy or sell a CEF simply because of its z-score. Further analysis as to why the current discount has deviated so far from its historic average is warranted.

Key Takeaways

  • Buy-and-hold investors can use z-scores to determine whether the absolute discount/premium is truly signaling that the CEF is under- or overvalued or whether the absolute discount/premium could be a value trap.
  • Trading-oriented investors can z-scores to find candidates for buying or selling short. (In practice, this is the most common use of relative discounts/premiums.)
  • Regardless of how they are used, they are no guarantee of future investment gains. All that matters once a CEF is purchased is the subsequent total return. Just as absolute discounts/premiums can converge to NAV with no gain for the shareholder, so too can relative discounts/premiums.
  • It is important to understand why a CEF is trading at a current discount/premium that is widely divergent from its historic average. There could be a very good reason, aside from market sentiment.

CEF Discounts and Premiums

(information from Morningstar.com’s CEF section)

CEFs have an underlying portfolio of securities. From this portfolio, a net asset value (NAV) can be derived.

NAV = (assets – liabilities) / shares outstanding

the investment portfolio primarily, if not solely, comprises the assets. For leveraged CEFs, the leverage itself is the bulk of the liabilities.

CEFs trade on an exchange. This means that they have a share price, which is set by the market. These two prices, the NAV and the share price, are rarely the same, and when they are, it's only by coincidence.

The differences between the share price and the NAV create discounts and premiums. Shares are said to trade at a "discount" when the share price is lower than the NAV.  The discount is commonly denoted with a minus ("-") sign. Shares are said to trade at a "premium" when the share price is higher than the NAV. The premium is commonly denoted with a plus ("+") sign. The calculation is (Share price ÷ NAV) – 1. Examples:

Share price = $19.00

NAV = $20.00

Discount = ($19.00 ÷ $20.00) – 1 = 0.95 – 1 = -0.05 = -5.0%

Share price = $12.00

NAV = $10.00

Premium = ($12.00 ÷ $10.00) – 1 = 1.20 – 1 = +0.20 = +20.0%

What gives rise to discounts and premiums? Why is the market seemingly inefficient?

Efficient market hypothesists have tried to explain discounts and premiums for years with myriad explanations. Most commonly, the reason a CEF trades at any given discount or premium is related to the fund's distribution rate, regardless of the source of the distribution. (Some fund families seemingly abuse the knowledge that this occurs to justify--in their minds, not ours--the use of destructive return of capital.)

Other typical reasons for premiums and discounts include:

  • Overall market volatility
  • Recent NAV and share price performance
  • Brand recognition of fund family
  • Name recognition (or lack thereof) of the fund manager
  • Recent changes in distribution policy
  • An asset class or investment strategy falling out of market favor
  • An asset class or investment strategy rising in the market's esteem

Whatever the reason for a CEF's discount or premium pricing, it is crucial that CEF investors realize that discounts and premiums exist.

At Morningstar, when comparing a share price with a NAV, we often refer to discounts and premiums as "Absolute Discounts" and "Absolute Premiums."

We do this because, as discussed in another Solution Center presentation, there are other ways to look at discounts and premiums. For instance, if we compare a CEF's discount to its average historic discount, this is what we refer to as a "Relative Discount."

Most long-term investors just look at Absolute Discounts and Absolute Premiums. But when considering valuation, it's important to look at Relative Discounts and Relative Premiums.

There are three things to consider regarding discounts and premiums:

  1. Regardless of the discount or premium, what matters to an investor is the share price at the time of purchase and the subsequent total return of the CEF.
  2. A CEF's discount or premium tends to persist. If the CEF typically trades at a large discount, it will tend to stay at a large discount, barring any corporate actions from the board of directors. The same can be said of premiums. Even in periods of extreme market volatility, CEFs that typically trade far below or far above the universe's average discount will more than likely continue to trade that way, even if during the downturn the premium turns to a discount.
  3. Over a complete market cycle, most CEF share prices will trade below, at, and above their corresponding NAVs.

Absolute Discounts

The standard thinking for CEFs is to focus on funds trading at discounts and to avoid funds trading at premiums. We think this maxim is simplistic and could lead to unrealistic expectations for investors.

All that matters for a CEF investor is the share price at which the CEF was purchased and the subsequent total return. Discounts and premiums wax and wane over time. For instance, if a CEF is trading at a 15% discount, people often tout this as an opportunity to buy $1.00 of assets for $0.85. The unstated premise is that eventually the price will reach $1.00.

This is problematic. Nothing mandates that a share price, even discounted at 15% to NAV, must converge to its NAV over time. Furthermore, the NAV could decline to $0.85 (or lower).

We recommend not purchasing CEFs at absolute discounts in the hope that the share price will converge to a higher NAV. The primary benefit of purchasing a CEF at an absolute discount is for income-seeking investors to enhance their yield.

"Yield Enhancement" and Absolute Discounts

Putting aside sources of distribution, let's assume that a fund's underlying portfolio at NAV yields 10%.

Distribution = $1.00 per share

Net Asset Value = $10.00 per share

Distribution Rate at Net Asset Value = $1.00 / $10.00 = 10%.

Let's further assume that the shares trade at a 10% absolute discount.

Net Asset Value = $10.00 per share

Share Price = $9.00 per share

Absolute Discount = (share price – NAV)/NAV = ($9 - $10) / $10 = -10%

Because they are buying at a discount, investors purchasing these shares will get a higher yield:

Distribution = $1.00 per share

Share Price = $9.00 per share

Distribution Rate at Share Price = $1.00 / $9.00 = 11.1%

So, "Yield Enhancement" = Dist Rate (Share Price) / Dist Rate (NAV) = 11.1% / 10% = 1.1%

Buying $1.00 of assets for $0.85 isn't necessarily a bargain.

The table below sets forth the nine scenarios that can play out when purchasing shares at an absolute discount.

image

How the Absolute Discount Can Narrow

  1. NAV falls faster than the share price: This is the worst possible scenario. The underlying portfolio is losing value and your shares are worth less.
  2. NAV falls and share price remains steady: This is the second-worst scenario, in that the underlying portfolio is losing value. At least your shares haven't declined in value.
  3. NAV falls and share price rises: The investment portfolio is heading south but at least you are making some money. Be careful, though, because ultimately the discount or premium will rely, at least in part, on the portfolio's performance.
  4. NAV is steady and share price rises: This is the scenario implied by investors who say they buy $1.00 for $0.85.
  5. NAV rises and share price rises even faster: This is the best of all possible scenarios. Of the nine scenarios, this occurs in only half of one (because the NAV could rise faster than an increasing share price, meaning the discount would widen).

Also note the several scenarios where the share price declines or the absolute discount widens. Using absolute discounts as the sole method of finding undervalued CEFs is akin to investing in a value trap.

On the flip side, there is no reason to avoid all CEFs trading at an absolute premium.

If you are purchasing shares at an absolute premium, you are taking on risk. Your capital could decline, even if the underlying portfolio performs well.

This isn't to say you should never invest at a premium. Most CEF investors have no qualms investing at slight premiums to NAV. But absolute premiums above 10% should really give you pause.

The table below shows the nine scenarios that can play out when purchasing shares at an absolute premium.

image

If you find yourself in a situation where the share price is rising and the NAV is declining, you are likely in what Warren Buffett might call a "greater fool" scenario. You may want to consider taking your profits and finding a more suitable investment.

Note that only one half of one scenario leads to a rising share price and a narrowing premium.

Unwittingly purchasing shares at an absolute premium, only to see the share price decline as the premium narrows, is the number one reason people have a poor experience with CEF investing.

Key Takeaways

  • Every CEF has a discount or a premium. It is rare, and short-lived, for a share price to equal the net asset value.
  • Absolute discounts are an inappropriate method of finding undervalued CEFs. When searching for undervalued CEFs, use relative discounts
  • Absolute discounts can and should be sought for "yield enhancement." Make sure to see our Solution Center presentation on distributions.
  • Absolute premiums should not preclude investment, but they do represent additional investment risk. Extreme premiums above 10% should really give investors pause. Unless the NAV rises to meet your purchase price, even in the long run you will likely lose money on your investment.
  • While there is nothing that mandates a CEF share price equal its net asset value, history shows that funds normally trade at both an absolute discount and an absolute premium over the course of a full market cycle. In other words, the share price does tend to revert toward, and then through, the NAV.
  • Again, when investing in CEFs, discounts and premiums don't ultimately matter. What matters is your cost basis and the subsequent total return.

Understanding Leverage in a CEF

What Is Leverage?

Leverage simply means that an investment portfolio is larger than its net asset base. The fund raises additional capital through a debt issuance, a preferred share issuance, or by using sophisticated financial products to increase the value of its underlying portfolio.

Say, for example, a fund has net assets of $500 million, raised in an initial public offering of 50 million common shares.

  • It then issues $250 million of preferred shares.
  • Total capital is then $750 million.
  • Common shares outstanding are 50 million.
  • Total capital per share is $15.00
  • Net asset value per share = (Total Capital - Liabilities (preferred shares)) ÷ Shares Outstanding = ($750 million - $250 million) ÷ 50 million = $500 million ÷ 50 million = $10.00

This CEF has a leverage ratio of 50%, computed as capital from preferred shares divided by net asset value: $5 from preferred shares ÷ $10 in net asset value = 50%

Leverage magnifies returns, both positively and negatively. In other words, a leveraged fund exhibits more volatility than would an unleveraged fund investing in the same securities.

Why Can CEFs Use Leverage?

Because of their closed-end structure, CEFs are allowed by law to use leverage. Specifically, according to the Investment Company Act of 1940--which provides the framework for CEFs, mutual funds, and ETFs--CEFs are allowed to issue:

  • Debt in an amount up to 50% of net assets
  • Preferred shares in an amount up to 100% of net assets

In practice, the average leveraged CEF carries 33% total leverage. For every $1.00 of net assets, they have another $0.33 in leveraged capital.

Non-'40 Act Leverage

Leverage achieved through debt and preferred shares is commonly referred to as "'40 Act Leverage," after the Investment Company Act of 1940. There are other methods by which a fund can leverage its net assets. This is referred to as "Non-'40 Act Leverage."

Whereas the provisions for leverage within the '40 Act were meant to safeguard the integrity of a fund's capital structure, non-'40 Act leverage is unrelated to the capital structure. It arises, instead, from the fund's portfolio of investments. Examples of non-'40 Act leverage include:

  • Tender option bonds
  • Reverse repurchase agreements
  • Securities lending obligations

Transparency

Leverage is leverage. Regardless of the source of the leverage, it has the same effects on a portfolio as outlined earlier in this presentation. This is why transparency of a fund's true leverage is so important.

Only '40 Act leverage is required by law to be reported. All leverage is actually reported on the financial statements, but only '40 Act leverage needs to be reported as "leverage."

Fund families have wide discretion in how they choose to actively report non-'40 Act leverage. Their websites may say a fund is unleveraged, when it actually has a lot of non-'40 Act leverage.

One simple way for investors to check leverage ratios is the following:

Total Leverage = Total Assets / Net Assets

The closer the value is to 1, the lower the leverage.

Morningstar.com shows a CEF's '40 Act leverage, non-'40 Act leverage, and total leverage ratios to help investors see what's really going on.

Key Takeaways

  • Adding leverage to a CEF's portfolio will increase volatility of NAV returns.
  • Adding leverage can also enhance a CEF's distribution rate.
  • There are costs to adding leverage to a portfolio.
  • While the Investment Company Act of 1940 allows CEFs to issue debt and preferred shares (with certain limitations), CEFs can also use non-'40 Act leverage.
  • Regardless of the source of the leverage, the effects will be the same.
  • In times of extreme market distress, a leveraged fund may be forced to liquidate holdings to meet leverage coverage ratios. In such rare cases, the benefits of the closed-end structure eviscerate, and the capital is permanently impaired. In 2008 and 2009, this happened to a few leveraged high-yield ("junk bond") CEFs.
  • While many investors are rightfully cautious about leverage, it's important to understand that the average leveraged CEF is only 33% leveraged.

I will be adding a rule to my CEF watch list to exclude CEF’s that are 30% or more leveraged.

Friday, April 22, 2016

Quick Fundamental Stock Summary

I am a fundamentalist first in most of my trading strategies be it Income, Growth, Value, Blend or whatever. I believe the stock needs to be fundamental strong or at least be aware of weak spots before using technical analysis to enter and exit positions. On that note, I created a google spreadsheet to help me in taking a quick look at a stock I am interested in. I thought I'd share that sheet with any of the stockaholics interested in fundamentals.


Access it here: Stock Summary Report


This link is a view only share so you can't make any changes to it. You need to be signed into your google account to save a copy. Once you save a copy the only thing you need to do is type the stock symbol you want to look at in cell A1 on the first tab. It will auto populate that page and the other tabs as well. Hope you enjoy it.

Sunday, November 22, 2015

Learn Fundamental Analysis

Business Finance Online - This site is an interesting learning site in understanding how to evaluate the financial condition of a company and spotting value.  A lot of the things on this site can be obtained at online quote sites but this helps break down how they are calculated plus have some info that cannot be obtained unless you calculate yourself.  Information and calculator pages are simply good and the site is free, no advertising and no registration required. 

Google+