The economic cycle is an important concept to understand when investing in stocks. It is helpful to know where the overall economy is sitting in order to see what sectors of stocks might be under performing or over performing the S&P benchmark. It also helps in forming an overall market posture and get prepared for a bear market and/or get back in at the beginning of a bull market. The younger a person is doing long term investing the less this needs to be a focus. However, once a person gets 10 to 15 years from retirement this knowledge can become critical in maintaining a nest egg that has been building. Since an economic cycle can take 7 to 10 years to play out, as you get nearing retirement and can see that a late expansion situation exists, like the one I think we are currently in, then one should pay attention to how aggressive they have allocated their 401K or IRA and take steps to become less aggressive by transferring into safer funds etc.

Last 6 months sector performance as of June 21, 2016

Last 3 months sector performance as of June 21, 2016

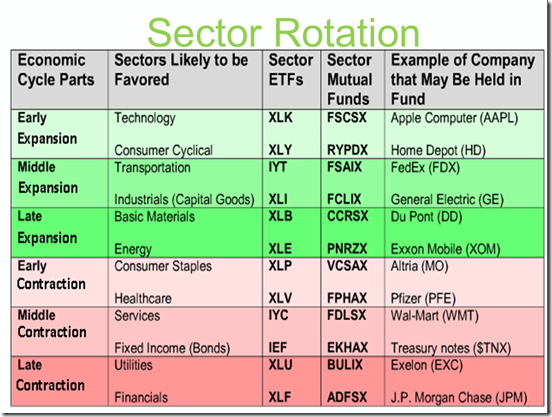
These sectors will never follow a “textbook” looking scenario so one has to make judgements on what you see. In the 6 month performance even though Utilities (late expansion) show strength, Energy, Materials and Consumer Staples are prominent indicating late expansion to early contraction. Then in the 3 month performance Utilities has slipped but late expansion to early contraction continue to outperform SPY (S&P benchmark). This is why I think we are currently in late expansion. The market has been moving sideways for sometime now and as it moves sideways money has been leaving consumer discretionary and technology sectors and moving into safer consumer staples, energy and utilities. With the market stalled right now, growth stocks are not getting the fuel they need to drive prices up. While it might take another year to enter contraction, I think the threat is real because it is the normal flow of the economic cycle. Below is an explanation of the economic cycle and business cycle and what to look at to help determine where we are. Hint, the GDP report is very important.
What is the 'Economic Cycle'
The economic cycle is the natural fluctuation of the economy between periods of expansion (growth) and contraction (recession). Factors such as gross domestic product (GDP), interest rates, levels of employment and consumer spending can help to determine the current stage of the economic cycle.
BREAKING DOWN 'Economic Cycle'
An economy is deemed to be in the expansion stage of the economic cycle when gross domestic product (GDP) is rapidly increasing. During times of expansion, investors seek to purchase companies in technology, capital goods and basic energy. During times of contraction, investors will look to purchase companies such as utilities, financials and healthcare .
What is the 'Business Cycle'
The business cycle is the fluctuation in economic activity that an economy experiences over a period of time. A business cycle is basically defined in terms of periods of expansion or recession. During expansions, the economy is growing in real terms (i.e. excluding inflation), as evidenced by increases in indicators like employment, industrial production, sales and personal incomes. During recessions, the economy is contracting, as measured by decreases in the above indicators. Expansion is measured from the trough (or bottom) of the previous business cycle to the peak of the current cycle, while recession is measured from the peak to the trough. In the United States, the National Bureau of Economic Research (NBER) determines the official dates for business cycles.
BREAKING DOWN 'Business Cycle'
According to the NBER, there have been 11 business cycles from 1945 to 2009, with the average length of a cycle lasting about 69 months, or a little less than six years. The average expansion during this period has lasted 58.4 months, while the average contraction has lasted only 11.1 months.
The business cycle can be effectively used to position one’s investment portfolio. For instance, during the early expansion phase, cyclical stocks in sectors such as commodities and technology tend to outperform. In the recession period, the defensive groups like health care, consumer staples and utilities outperform because of their stable cash flows and dividend yields.
As of January 2014, the last expansion was determined to have commenced in June 2009, the period when the Great Recession of 2007-09 reached its trough (technically, that recession began in December 2007).
Expansion is the default mode of the economy, with recessions being much shorter and less common. So why do recessions occur at all? While economists’ views differ on this subject, there is a clear pattern of excessive speculative activity evident in the latter stages of expansion in many business cycles. The 2001 recession was preceded by an absolute mania in dot-com and technology stocks, while the 2007-09 recession followed a period of unprecedented speculation in the U.S. housing market.
The average length of an expansion has increased significantly since the 1990s. The three business cycles from July 1990 to June 2009 had an average expansion phase of 95 months – or almost 8 years – compared with the average recession length of 11 months over this period. While some economists were hopeful that this development marked the end of the business cycle, the 2007-09 put paid to those hopes.
Recessions can extract a tremendous toll on stock markets. Most major equity indexes around the world endured declines of over 50% in the 18-month period of the Great Recession, which was the worst global contraction since the 1930s Depression. Global equities also underwent a significant correction in the 2001 recession, with the Nasdaq Composite among the worst-hit as it plunged almost 80% from its 2001 peak to 2002 low.
What does 'Expansion' mean
Expansion is the phase of the business cycle when the economy moves from a trough to a peak. It is a period when the level of business activity surges and gross domestic product (GDP) expands until it reaches a peak. A period of expansion is also known as an economic recovery.
BREAKING DOWN 'Expansion'
An expansion is one of two basic business cycle phases; the other is contraction. The transition from expansion to contraction is a peak, and the changeover from contraction to expansion is a trough. Expansions last on average about three to four years, but they have been known to last anywhere from 12 months to more than 10 years. Much of the 1960s was a time of expansion, which lasted almost nine years.
Economists and policy makers closely study business cycles. Learning about economic expansion and contraction patterns of the past can help forecast potential trends in the future. Whether cash is available or scarce, interest rates are low or high, and companies and consumers can borrow money to spend on goods and services affects how businesses and consumers react.
What is a 'Contraction'
A contraction is a phase of the business cycle in which the economy as a whole is in decline. More specifically, contraction occurs after the business cycle peaks, but before it becomes a trough. According to most economists, a contraction is said to occur when a country's real GDP has declined for two or more consecutive quarters.
BREAKING DOWN 'Contraction'
For most people, a contraction in the economy can be source of economic hardship; as the economy plunges into a contraction, people start losing their jobs. While no economic contraction lasts forever, it is very difficult to assess just how long a downtrend will continue before it reverses because history has shown that a contraction can last for many years (such as during the Great Depression).
Examples of Expansion and Contraction
Expansion, or a boom, occurs when the Federal Reserve lowers interest rates and buys back bonds in the open market to add money to the financial system. The bondholders put their cash in the bank, which lends out money to companies that purchase buildings and equipment and hire workers. The employees produce more products and services to meet consumer demand as the economy improves. Unemployment is low while productivity and consumer spending are high. Money flows freely through the economy.
When the economy contracts, or busts, productivity declines, business revenues go down and companies lay off workers to decrease expenses. Unemployment rises, and consumers spend less. When the GDP declines over two consecutive quarters, a recession occurs. When productivity and revenue slowly begin increasing, economic recovery begins. The unemployment rate decreases as consumers spend more and the economy begins expanding.
Since 1945, the U.S. economy has gone through 10 expansion and contraction phases. Expansion periods included 1975 to 1980 and 106 months in the 1960s. Durable manufactured goods were more affected than services, as were wholesale and industrial prices more than retail prices.
Leading indicators such as average weekly hours worked by manufacturing employees, unemployment claims, new orders for consumer goods and building permits all give clues as to whether an expansion or contraction is occurring in the near future. While not completely accurate, knowledge about a certain industry or company can help prepare for changes in the economy before they occur.
http://www.investopedia.com/terms/e/economic-cycle.asp


