Stock Rover is as close to an all-in-one stop for stock information that I have seen. It has 2 separate sections that I refer to as the "Market" section and the "Stock Rover App" section. Both of these sections have a vast amount of useful underlying research information on the various stocks that make up the tradable stocks on the exchange. I will not be able to detail all of what you will find on this site. Just highlighting the areas that I find interesting will make for a long enough post. I can't stress enough that there is a ton of information under each tab and many more when hovering over some items or right clicking things like symbols.
You must register with Stock Rover. The registering is free and will give you access to everything I am talking about here. Premium membership is $250 per year. I don't think the Premium is necessary for most investors, especially smaller investors trying to learn. If you want to though they do have a 14 day free trial that you activate from the Stock Rover app menu with no credit card information required for the free trial. If you don't upgrade in the 14 days the app returns to the "free" version. Do not take this as an advertisement or recommendation, I have no affiliation and get no benefit from anyone subscribing.
Image 1 below is the main Markets page. I've highlighted a few things on here. Black menu bar at top is main sections and this shot is on Markets. On the Market section there is a lot to see. Notice the first set of tabs. It also is on Markets showing the performance of the overall indexes. Note that you can change the time frame to get up to one year performance. This tab also provides a lower table which is currently on Market Summary showing yet another table below that which is currently on Sectors. You can also change the time frame on sectors to get various views on strong sectors for whatever period you select. If you trade on the uptrends you want to use this to find which sectors are the best then drilling down into them to see what stocks are strong.
Notice the tabs along this table. In addition to Market Summary you have a Stocks, ETFs, Bonds, Commodities and Daily Analyst Ratings. Each of them has a summary for that day. Stock tab will show the largest movers for the day and top performers and top losers. Also note, the daily analyst tab shows companies that have been upgraded or downgraded for that day.
Image 1
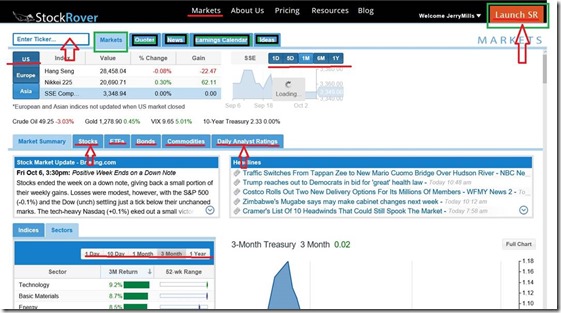
Image 2 shows the screen that you get when staying on the Markets section (top black menu) but moving the first table down to "Quotes". Here, if you have no tickers entered you need to have one. This shot is looking at Oracle (ORCL). Note the table right under that is currently on Financials but you have a Details, Chart, News, and Peers in addition. I just wanted to highlight the Financials so you could see the fundamental data available here. By clicking the + mark in each line reveals the data for that item. It is currently on Financial Health. Note the data and graphs. On the left side if you click on the existing "X" it will remove that item from the graph. Clicking on the graph icon will add the item. You can have up to 4 items in the graph.
Image 2

In Image 3 we again stay in the Markets section (Black menu bar at top) but in the first table we clicked on "Ideas". Stock Rover keeps a few "featured screeners" to run without having to go into the Stock Rover app (image 4 below) I just want to point out that in the image below sitting just below the list of screened stocks is "Other Featured Screeners" Click on one of them for a different type of screen. The active screen shows the details of what is being screened to the left of the list of stocks. Also not you can access he CNBC Video Feed (Lower Right of Image 3)
Image 3

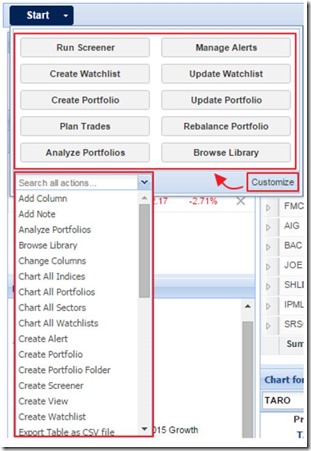
Lastly is Image 4 below which is the Stock Rover App. If you look on the images above it is located on the black menu bar at the top on the far right. Click the orange button "Launch SR" and it should open this up in a new tab or window depending on how you have your browser setting. This has just as many different places to explore as the "Markets" page so I won't try to get into too much detail here. I just want to highlight a few things. See the Start button (upper left of image 4)? Clicking that down arrow brings up a menu shown in Image 5 below. Look over the sections on this page. On the left side is the Market Summary, Quotes and Navigation. You simply have to click on the areas that I have highlighted in the Navigation section to see how really intensive this section is. As you highlight any of the stocks in the table in the middle (Research Tickers) It will populate the bottom chart and the right section labeled Insight for (symbol). Notice the grading system I highlighted in that box. Also note the tabs for additional details.
Image 4

Image 5 - Clicking arrow next to "Start" this is under the start menu
So this post just touches on the many features of this well laid out stock research website. I strongly recommend you spend a little time clicking through things here. As you click around in here you will probably come across some of the features only available to premium members but as of now it has not compelled me personally to pay for it. For me, I have another stock screening app that I am presently paying for that runs out in January of next year. At that time I might consider trying the premium. Lastly, below is a few links for more information about Stock Rover.
Compare features of Free vs Premium
https://www.stockrover.com/plans/compare/
Detailed Help for Stock Rover app (not Markets page)
https://www.stockrover.com/how-to/stock-rover-basics/right-click-menus/
17 page Getting Started Guide in PDF format for the Stock Rover app (not Markets page)
https://www.stockrover.com/library/pdf/getting-started-in-stock-rover.pdf
Created with Microsoft OneNote 2016.


