Showing posts with label Research. Show all posts

Sunday, October 8, 2017

A Look at Stock Rover

Stock Rover is as close to an all-in-one stop for stock information that I have seen. It has 2 separate sections that I refer to as the "Market" section and the "Stock Rover App" section. Both of these sections have a vast amount of useful underlying research information on the various stocks that make up the tradable stocks on the exchange. I will not be able to detail all of what you will find on this site. Just highlighting the areas that I find interesting will make for a long enough post. I can't stress enough that there is a ton of information under each tab and many more when hovering over some items or right clicking things like symbols.

You must register with Stock Rover. The registering is free and will give you access to everything I am talking about here. Premium membership is $250 per year. I don't think the Premium is necessary for most investors, especially smaller investors trying to learn. If you want to though they do have a 14 day free trial that you activate from the Stock Rover app menu with no credit card information required for the free trial. If you don't upgrade in the 14 days the app returns to the "free" version. Do not take this as an advertisement or recommendation, I have no affiliation and get no benefit from anyone subscribing.

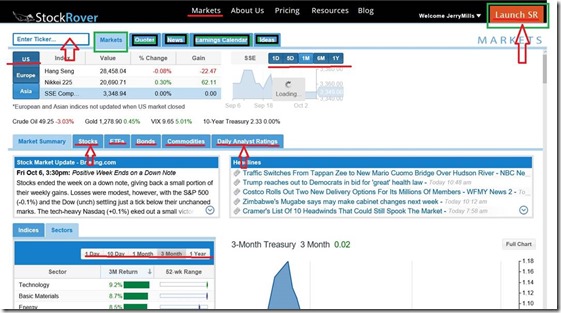
Image 1 below is the main Markets page. I've highlighted a few things on here. Black menu bar at top is main sections and this shot is on Markets. On the Market section there is a lot to see. Notice the first set of tabs. It also is on Markets showing the performance of the overall indexes. Note that you can change the time frame to get up to one year performance. This tab also provides a lower table which is currently on Market Summary showing yet another table below that which is currently on Sectors. You can also change the time frame on sectors to get various views on strong sectors for whatever period you select. If you trade on the uptrends you want to use this to find which sectors are the best then drilling down into them to see what stocks are strong.

Notice the tabs along this table. In addition to Market Summary you have a Stocks, ETFs, Bonds, Commodities and Daily Analyst Ratings. Each of them has a summary for that day. Stock tab will show the largest movers for the day and top performers and top losers. Also note, the daily analyst tab shows companies that have been upgraded or downgraded for that day.

Image 1
clip_image002

Image 2 shows the screen that you get when staying on the Markets section (top black menu) but moving the first table down to "Quotes". Here, if you have no tickers entered you need to have one. This shot is looking at Oracle (ORCL). Note the table right under that is currently on Financials but you have a Details, Chart, News, and Peers in addition. I just wanted to highlight the Financials so you could see the fundamental data available here. By clicking the + mark in each line reveals the data for that item. It is currently on Financial Health. Note the data and graphs. On the left side if you click on the existing "X" it will remove that item from the graph. Clicking on the graph icon will add the item. You can have up to 4 items in the graph.

Image 2

clip_image004

In Image 3 we again stay in the Markets section (Black menu bar at top) but in the first table we clicked on "Ideas". Stock Rover keeps a few "featured screeners" to run without having to go into the Stock Rover app (image 4 below) I just want to point out that in the image below sitting just below the list of screened stocks is "Other Featured Screeners" Click on one of them for a different type of screen. The active screen shows the details of what is being screened to the left of the list of stocks. Also not you can access he CNBC Video Feed (Lower Right of Image 3)

Image 3

clip_image006

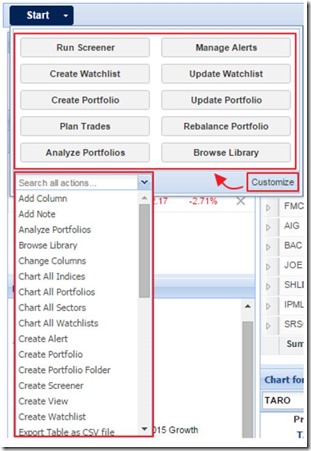
Lastly is Image 4 below which is the Stock Rover App. If you look on the images above it is located on the black menu bar at the top on the far right. Click the orange button "Launch SR" and it should open this up in a new tab or window depending on how you have your browser setting. This has just as many different places to explore as the "Markets" page so I won't try to get into too much detail here. I just want to highlight a few things. See the Start button (upper left of image 4)? Clicking that down arrow brings up a menu shown in Image 5 below. Look over the sections on this page. On the left side is the Market Summary, Quotes and Navigation. You simply have to click on the areas that I have highlighted in the Navigation section to see how really intensive this section is. As you highlight any of the stocks in the table in the middle (Research Tickers) It will populate the bottom chart and the right section labeled Insight for (symbol). Notice the grading system I highlighted in that box. Also note the tabs for additional details.

Image 4

clip_image008

Image 5 - Clicking arrow next to "Start" this is under the start menu
clip_image010

So this post just touches on the many features of this well laid out stock research website. I strongly recommend you spend a little time clicking through things here. As you click around in here you will probably come across some of the features only available to premium members but as of now it has not compelled me personally to pay for it. For me, I have another stock screening app that I am presently paying for that runs out in January of next year. At that time I might consider trying the premium. Lastly, below is a few links for more information about Stock Rover.

Compare features of Free vs Premium

https://www.stockrover.com/plans/compare/

Detailed Help for Stock Rover app (not Markets page)

https://www.stockrover.com/how-to/stock-rover-basics/right-click-menus/

17 page Getting Started Guide in PDF format for the Stock Rover app (not Markets page)

https://www.stockrover.com/library/pdf/getting-started-in-stock-rover.pdf

Created with Microsoft OneNote 2016.

Monday, April 24, 2017

A Couple of Worthy News Sites


In addition to the obvious business news sites that investors seek out for stock information like Google Finance, Yahoo Finance, Reuter’s and Bloomberg, there are also smaller less known sites that offer very good insight into stocks.  Here are two that I like. 

The Wellesleys News

http://thewellesleysnews.com/ 

image

Screen shot above shows the home page.  They update frequently during the day and categorize their stories according to the menu you see in black across the top of the page for Business, Consensus &  Forecast, Sector Snapshot, Trending Equities, and Top Yields.  Each section gives you a list of articles related to that topic.  This is a good place to check on watch list stocks as well as keeping current on the companies in your active portfolio.

The Cerbat Gem

Market News and Analysis

hhttps://www.thecerbatgem.com/category/headlines

image

Screen shot above shows the home screen.  Note the menu across the top just underneath the logo.  That separates articles by category much like Wellesley site.  I especially like the M&A section and Analysts’ Updates.  Both of these sites are worthy of bookmark space.  Another thing these sites are useful for is discovering good companies that may not turn up on other screens that you run to select stocks to research.

Monday, March 27, 2017

3/25/17 Barron’s Picks and Pans

(BZ Newswire) --

This weekend's Barron's takes a look at a long-suffering media company poised for a turnaround.

Other featured articles offer the prospects for a solar power outfit with a strong balance sheet and a lender in a sweet spot of high growth.

The outlooks for a chip maker riding a tailwind and a consumer electronics giant with a respectable dividend yield are also examined.

"Viacom Flips the Script: Stock Has 40% Upside" by Robin Goldwyn Blumenthal makes the case that long-suffering media company Viacom, Inc. (NASDAQ: VIAB) is tracking a new course toward a turnaround. See how a new CEO is shaking things up, shifting priorities and reinvesting in the company. The stock has risen since he took up the reins but still looks cheap, according to Barron's.

In "Dark Clouds May Be Lifting for SolarEdge," Andrew Bary suggests that shares of Solaredge Technologies Inc (NASDAQ: SEDG), which makes optimizers and inverters, could rise by 40 percent or more in the next year. See why Barron's thinks that, with its strong balance sheet, the solar power outfit offers staying power until the industry comes back in vogue.

Jack Willoughby's "Why Silicon Valley Bank's Stock Could Rise 25%" takes a look at whether this lender to venture capitalists and startups is headed into a sweet spot of high growth. Discover why Barron's believes SVB Financial Group (NYSE: SIVB) is poised for several years of rapid earnings growth that dwarfs expectations for most other banks.  

While the growth cycle at Micron Technology, Inc. (NASDAQ: MU) could be extended, it won't last forever, according to "Micron, Up 170%, Could Move Higher. But Be Wary" by Tiernan Ray. The current market conditions for Micron are proving extraordinarily favorable, though the CEO announced his retirement last month and the company has yet to name a successor.

In Johanna Bennett's "Apple iPhone, Dividend Buzz Can Keep Stock Hot," see why one key analysts says that even with Apple Inc. (NASDAQ: AAPL) shares near an all-time high, investors should expect another 20 percent gain. While Apple is trading near its highest price-to-earnings multiple in five years, there is much to like, including a respectable dividend yield.

Keep up with all the latest breaking news and trading ideas by following Benzinga on Twitter.

Sunday, August 14, 2016

3 Items to look for in a Stock

This is an excerpt from an article on Motley Fool regarding Google stock but the 3 items in the list below are valid and can be used when looking for very strong companies.  I have not worked out a stock screen yet to see if I can incorporate these 3 items into a screen but will be looking to do so.  I especially need to look at item 3 below to better understand what that means.

The Motley Fool | 2016-08-13T18:04:00Z

No book has had a more profound impact on my investing than Nassim Taleb's Anti fragile. It argues that the entire world can be broken into three categories:
  • The Fragile: things that break as soon as stress is applied -- like a glass falling off of a table.
  • The Robust: things that stay absolutely the same under stress -- a rubber ball falling from the same table.
  • The Anti fragile:things that become more powerful when stressors are introduced -- think of how your bone heals back stronger than before after it's broken.
We want our portfolios to be as anti fragile as possible. But we often fail at this. That's largely because we are suckers for the narrative bias: We tell ourselves a story about a company: how its sales will grow and its products will revolutionize the world, and we invest accordingly.
I created a compelling narrative for the first stock I ever wrote about for The Fool six years ago. Since then, that stock has trailed the market by a whopping 172 percentage points!
By viewing the investing world through an "anti fragile" lens, I eliminate the narrative bias by focusing on three attributes:
  1. Lots of cash and lots of customers: cash gives companies options during downturns -- outspending rivals, buying back stock, or acquisitions. Debt does the opposite. And by having lots of customers, a company doesn't run the risk of losing an outsized portion of business if a client walks away.
  2. Management with skin in the game: When the people running the company have their own skin in the game -- via shares of the company's stock -- their long-term interests are aligned with ours. That benefit compounds when founders are running the company, as they often view it as a literal extension of themselves.
  3. A barbell approach:This means having two sides to your strategy -- on one hand you have a business segment that has a wide moat. On the other hand, you take lots of low-probability, low-risk, high-reward bets -- a trait otherwise known as "optionality".

Sunday, May 22, 2016

A Look at Stock Rover

Alex Reisman of Stock Rover gives an overview of the online stock research platform.

At a glance:

  • Online stock research software
  • Screening, stock comparison & portfolio analysis
  • Link to brokerage for automatic portfolio syncing
  • Free & paid membership plans

Stock Rover is an interactive “dashboard” where you can engage in robust stock research. Stock Rover’s goal is to help individual investors make informed, independent decisions and to support them in their investing goals.

There are two membership levels: Basic (free) and Premium ($249.99/year or $74.99/quarter). Both levels provide detailed data on North American tickers, using the same integrated, comparison-oriented format. The major advantages that Premium offers over Basic are more financial metrics, 10 years of historical data rather than five, data export to offline CSV files, more flexible screening, deeper portfolio analysis, portfolio planning tools, and an ad-free environment. A 14-day free trial of Premium is available to all users (no payment information is needed; learn how to start the trial here).

Once you register for the FREE version and sign in you will go to a Summary page.  Look for an Orange button in the upper right corner of the page that says : “Launch SR” and click on that.  This will take you to the Stock Rover Basic application shown in the screen shot below.

image

The above screen shot is showing where the strong sectors of the overall S&P is right now.  You can sort by any of the columns.  Day traders want to see what's strong now.  Swing traders might want to see what’s strong over the past 5 days while trend traders or intermediate traders might look at the past month for strength.  Then you can drill down into the sectors to show what industries are strongest then drill into the industries for a list of stocks in that industry to see what particular companies are the strongest.  Once you select a company details of the stock show up using the tabs, side bar and comparisons highlighted in the screen shot below.

image

Good site well worth the time to register and learn how to use…

Friday, April 22, 2016

Quick Fundamental Stock Summary

I am a fundamentalist first in most of my trading strategies be it Income, Growth, Value, Blend or whatever. I believe the stock needs to be fundamental strong or at least be aware of weak spots before using technical analysis to enter and exit positions. On that note, I created a google spreadsheet to help me in taking a quick look at a stock I am interested in. I thought I'd share that sheet with any of the stockaholics interested in fundamentals.


Access it here: Stock Summary Report


This link is a view only share so you can't make any changes to it. You need to be signed into your google account to save a copy. Once you save a copy the only thing you need to do is type the stock symbol you want to look at in cell A1 on the first tab. It will auto populate that page and the other tabs as well. Hope you enjoy it.

Google+