Friday, April 22, 2016

How to Paper Trade with Google Finance


Paper trading can be very educational in learning different trading strategies without costing expensive lessons using real money. One downside to paper trading is that you are able to trade without emotion since you are not risking real money so a system that works for you in paper money will not work in real money unless you use the same emotional framework you used in paper money.
Let's get started. Go to https://www.google.com/finance and click on Portfolios on the left sidebar menu and then look for a button

Give a descriptive name as you can create as many of these as you want. I like to have one for Growth, Value, Income and Penny stocks.

Once you name the portfolio you get the below screen. Click the "Deposit" to fund with your play money.

I just do 100,000 for each portfolio but here is your chance to be a pretend multi-millionaire if you want.

Once you click "Add to portfolio" shown in screen shot above, you will get the screen shown below. From here, you can manually add symbols or bring up a stock summary in Google Finance to add stocks to your portfolio.

To add manually put the symbol you want in the box and click the + sign Add transaction data. Or, from stock summary screen below click Add to portfolio
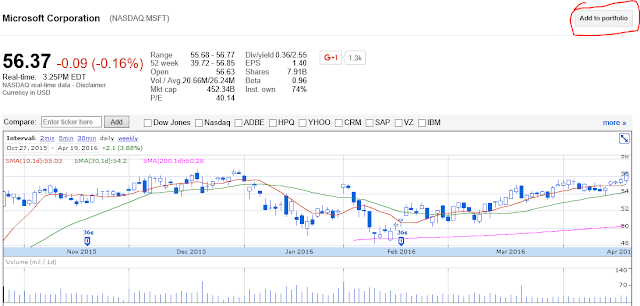
Fill in the information in the transaction section asked for in the screen shot below. It is not necessary to add a commision but I like to do so as it gets calculated in actual gain/loss and helps me account for them when I trade real money. Important, don't forget to check the box for "Deduct from cash" Since you can't automatically enter stop orders you should make a note as to where you would stop out if stock drops and if it happens, click the "Add transaction" and enter in a sell order.

Check "Deduct from cash"

There you go, your very own Paper Money trading platform. Hope you enjoy it.
This only deals with creating the paper money portfolio and may leave many new investors with a lot of questions on what should I buy, how many shares should I buy, when should I buy or when should I sell. All great questions that you should continue to learn about.

Friday, February 26, 2016

Market Forecast for Friday Feb 26th

David Settle from Invest tools gives a daily market forecast at the end of each day.  He is quite good at explaining why the market is doing what it is doing and suggests how he thinks it might react on the next trading day.


Market Forecast for end of trading Feb 26th

Saturday, January 23, 2016

Market Forecast - 01/22/2016 - David Settle


Good perspective on current market volatility.  30 minute listen

David uses a proprietary tool called Market Forecast that is available on TD Ameritrade charts as a lower study.  After listening to a few of his daily market forecasts you can pick up on how to use the tool as a leading indicator.

Sunday, November 22, 2015

Learn Fundamental Analysis

Business Finance Online - This site is an interesting learning site in understanding how to evaluate the financial condition of a company and spotting value.  A lot of the things on this site can be obtained at online quote sites but this helps break down how they are calculated plus have some info that cannot be obtained unless you calculate yourself.  Information and calculator pages are simply good and the site is free, no advertising and no registration required. 

Friday, September 25, 2015

Market Correction or Start of Bear?

3 Month performance of all ETF's July, Aug, Sept 2015

Market has been overall bad past 3 months.  The question is are we just correcting or starting a downtrending bear market?  The optimist in me says we are at the bottom of a correction.


http://finviz.com/publish/092515/etf_w13_111377078.png

Sunday, August 9, 2015

My Take On The Market

I have not posted anything for about a month now due to summertime activities and necessary work/research on my portfolio.  Also, my education takes up a lot of time as I continue to learn as much as I can about stock investing trading systems like Growth, Value and Income methods along with how and what to watch with the economy as a whole to “indicate” future direction.

Lately I have been seeing things online from the “Experts” and a few are saying we are headed for a major crash of 50% or more.  I hate these bear type doomsayers because they like to act like they have all the “data” behind their opinion and know what they are saying.  Some even point to their past accurate predictions of past stock crashes.  The real facts and data just get in the way for these guys.  I could easily tell you today that the market is going to crash by 50% in the next 6 months.  Then, 2 years later the data might support and hint to this and actually happen and I’ll say.  Oh, yeah, I predicted this I saw it coming.

Just as bad on the bull side are the experts that tell you to use their investing methods to double and triple your portfolio even in down markets.  They will sell you a system that any normal person is unlikely to have the stomach to follow and when everything goes south on you the expert will say that you didn’t follow the plan exactly as they sold it to you.

One major thing I’ve concluded with what my current training has convinced me of is that both camps are HOGWASH.  Anyone that thinks they can predict where the market is heading by interpreting one or two “signals” or bases things on “The last time I saw this combination of events…”  is full of bear or bull crap.

So here’s a few basic concepts I have adopted from my training with Investools not because they told me to but because what they are teaching is reasonable and verifiable through past performance and use of play money in a paper money platform to monitor current trades and try methods without any risk. 

First and foremost is that it is not a question of if the market will go down, it’s only a question of WHEN will it go down.  The reverse holds true for upward movement.  This is a fact since it moves one way or the other every trading day.

Second, prices on stocks are based on one seller saying I want “$X” for my share of company YZ, or one buyer saying I will pay “$X” for your share of company YZ.  It’s no more complicated than that.  The complication comes into play in what motivates the buyer or seller to bid on what they are willing to pay for or accept for their shares.

What makes a seller say, I’ve had enough with this company and want out versus a buyer who thinks the seller is wrong? 

What a company earns (profits) and more importantly what the company is expected to earn up to 5 or 10 years down the road is what drives the price of the stock, not past data and not current earnings.  When a buyer comes in it is on the expectation that the company will do better in the future..  This concept is very important and somewhat difficult to wrap your head around.  This is where past data is considered because it is what drove the engine to it’s current location.  Motion tends to continue in the direction it is moving unless acted upon by another force (basic physics) 

This is where current data driving the overall engine of the market comes into play because they contain forces that can change the direction of the engine on companies thus impacting future profits and drive the price up or down. 

But, just as important is the companies future guidance they provide when reporting current quarterly profits.  Companies provide their plans for the future and analysts consider the companies ability to deliver what they are projecting.  That is the information that if positive and analysts agree is possible will drive a stocks price up and conversely down if either the companies guidance or a failure to convince the analysts.

Wednesday, July 1, 2015

Investment Risks–Let me count the ways

When I first started investing I was well aware that there were risks involved but I had the most basic idea that risk was simply the threat of stock going lower then what you paid for it thus creating a loss.  I had no real idea of how varied risks were and how to manage it.  Because of that lack of knowledge, my first year had mixed results and thankfully were not totally devastating but did keep my overall returns flat because I did not know how to manage the stocks that were falling.  When I delved into the subject of investment risks I learned just how many types of risks were present. 

There is two categories of risk, unsystematic and systematic.  Unsystematic risks can be lessened through diversification of the portfolio as opposed to systematic risks that do not respond to diversification.

Examples of unsystematic risks are:

Business/Financial Risk:  This risk is specific to a company or industry.  Company profits can change based on management decisions or industry trends.  Financial risk comes into play when companies take on to much debt and management perceptions of the company’s ability to repay is misjudged. 

Event Risk.  This risk is caused by an unforeseen event that impacts the company’s finances like tax law changes or regulation changes.  Also lower then expected quarterly earnings and revenue surprises are event risks.

Political Risk.  This risk primarily applies to forgein stocks where changes in political and economic climates are not stable

Liquidity Risk. This is the risk of not being able to sell an asset quickly near or at the market price.  U.S. stocks are considered the most liquid but even in the U.S. volume levels must be considered for quick exits.

Examples of systematic risks are

Inflation Risk.  This risk applies primarily to bond, CD’s and other fixed income type investments.  Erodes your buying power if inflation exceeds returns set on the fixed income instruments.

Reinvestment Risk.  This is the opposite of the inflation risk.  If interest rates are falling when fixed income assets and are to be re-invested, the rate of return will be less then desirable.

Exchange Rate Risk.  This risk applies mostly to forgein stocks.  Currency exchange rates are constantly changing so you could be buying on a strong dollar and selling on a weak dollar which impacts how much you get in U.S. dollars.

Market Risk.  This risk affects all types of securities and most often is driven by changes in the economy.

Understanding these risks are important considerations as one evaluates where to allocate what percentage of what assets in the overall portfolio.  How much in stocks?  How much in bonds/fixed assets?  In the stock portion, how much in income versus how much in growth stocks?  In the bod portion, how much in long term versus short term?  Then, in stock selection, how much do I risk in each stock?  How do I manage that risk?

When I said above that my idea of risk was the risk of the price of my stock going down, while accurate, certainly fell way short of the actual risks.  As I learned about these risks over the next 3 years of my vast experience, I have made several adjustments to my investment methods to mitigate the risks so I am not as exposed as I was.  But, let there be no mistake, as much as you learn about risk you cannot eliminate it if you seek to be successful in your investments. 

Google+