Sunday, May 22, 2016

A Look at Stock Rover

Alex Reisman of Stock Rover gives an overview of the online stock research platform.

At a glance:

  • Online stock research software
  • Screening, stock comparison & portfolio analysis
  • Link to brokerage for automatic portfolio syncing
  • Free & paid membership plans

Stock Rover is an interactive “dashboard” where you can engage in robust stock research. Stock Rover’s goal is to help individual investors make informed, independent decisions and to support them in their investing goals.

There are two membership levels: Basic (free) and Premium ($249.99/year or $74.99/quarter). Both levels provide detailed data on North American tickers, using the same integrated, comparison-oriented format. The major advantages that Premium offers over Basic are more financial metrics, 10 years of historical data rather than five, data export to offline CSV files, more flexible screening, deeper portfolio analysis, portfolio planning tools, and an ad-free environment. A 14-day free trial of Premium is available to all users (no payment information is needed; learn how to start the trial here).

Once you register for the FREE version and sign in you will go to a Summary page.  Look for an Orange button in the upper right corner of the page that says : “Launch SR” and click on that.  This will take you to the Stock Rover Basic application shown in the screen shot below.

image

The above screen shot is showing where the strong sectors of the overall S&P is right now.  You can sort by any of the columns.  Day traders want to see what's strong now.  Swing traders might want to see what’s strong over the past 5 days while trend traders or intermediate traders might look at the past month for strength.  Then you can drill down into the sectors to show what industries are strongest then drill into the industries for a list of stocks in that industry to see what particular companies are the strongest.  Once you select a company details of the stock show up using the tabs, side bar and comparisons highlighted in the screen shot below.

image

Good site well worth the time to register and learn how to use…

Thursday, May 19, 2016

Why Starting Young with Long Term Strategy Pays Off

Stocks That Raise Their Dividends Greatly Outperform

Academic and industry studies confirm that quality dividend payouts lead to strong future returns. That’s a mouthful to be sure, but what it distills down to is that as an investor, dividends allow you to have your cake and eat it too! Dividends provide you with a valuable income stream, plus they can play an important role in helping you focus in on stocks that have the ability to produce staggering share price growth.

In order to appreciate the predictive power of dividends, consider a recent study conducted by Ned Davis Research and Oppenheimer Funds (see Figure 1 below).

The study looked at the average annualized returns for S&P 500 stocks from 1972 to 2014. As you can see, during this impressive 42-year study, stocks with Rising Dividends greatly outpaced the stocks that cut their dividends or simply did not offer a dividend in the first place. Further, if you focused on investing in Rising Dividend Stocks over fixed dividend stocks, you would have received 32% more return each and every year of the 42-year study.

(above is from AAII)

Tuesday, May 10, 2016

Barrons Review of iViewMarkets

Top Websites for Quantitative Stock Analysis


IVIEWMARKETS (iviewmarkets.com) is a similar market-analytics Website, but it focuses on data-gathering. It provides real-time market information and tools to rate the prospects of 10,000 U.S.-listed stocks and funds. But, instead of the proprietary factors used by Chaikin, iVIEWMarkets, a just-launched free site, employs off-the-shelf technical and fundamental measures. The company was started by Brett Golden, its president, who also founded the paid site ChartLabPRO (chartlabpro.com), which features its own proprietary tools.
Like Chaikin Analytics, the graphical nature of the site helps visitors follow its often-overwhelming data stream. Charts, heat maps, and gauges facilitate quick interpretation of popular internal market indicators and individual security metrics.
Complementary indicators are grouped together into views outfitted with just the tools and data appropriate to them. For example, the Trader View mixes the week’s best- and worst-performing Standard & Poor’s 500 members, overbought and oversold securities, and the relative performance of the week’s best industries.
These kinds of market triggers often find their way into trading algorithms. But iVIEWMarkets doesn’t offer the kind of algorithm-building platform found on social quant sites, such as Quantopian (quantopian.com). Its focus is to identify and deliver key market data—in real time.
During the recent market slaughter, iVIEWMarkets e-mails delivered changing support and resistance levels for all securities in subscriber portfolios daily. Chartists with a better-than-average knowledge of technical analysis can figure these out. But think of the time saved by having a dozen or more of these key entry and exit inputs recalculated for you every day.
Time is always of the essence. And for traders, not just any knowledge, but rather actionable information, is power.


Friday, April 22, 2016

Quick Fundamental Stock Summary

I am a fundamentalist first in most of my trading strategies be it Income, Growth, Value, Blend or whatever. I believe the stock needs to be fundamental strong or at least be aware of weak spots before using technical analysis to enter and exit positions. On that note, I created a google spreadsheet to help me in taking a quick look at a stock I am interested in. I thought I'd share that sheet with any of the stockaholics interested in fundamentals.


Access it here: Stock Summary Report


This link is a view only share so you can't make any changes to it. You need to be signed into your google account to save a copy. Once you save a copy the only thing you need to do is type the stock symbol you want to look at in cell A1 on the first tab. It will auto populate that page and the other tabs as well. Hope you enjoy it.

How to Paper Trade with Google Finance


Paper trading can be very educational in learning different trading strategies without costing expensive lessons using real money. One downside to paper trading is that you are able to trade without emotion since you are not risking real money so a system that works for you in paper money will not work in real money unless you use the same emotional framework you used in paper money.
Let's get started. Go to https://www.google.com/finance and click on Portfolios on the left sidebar menu and then look for a button

Give a descriptive name as you can create as many of these as you want. I like to have one for Growth, Value, Income and Penny stocks.

Once you name the portfolio you get the below screen. Click the "Deposit" to fund with your play money.

I just do 100,000 for each portfolio but here is your chance to be a pretend multi-millionaire if you want.

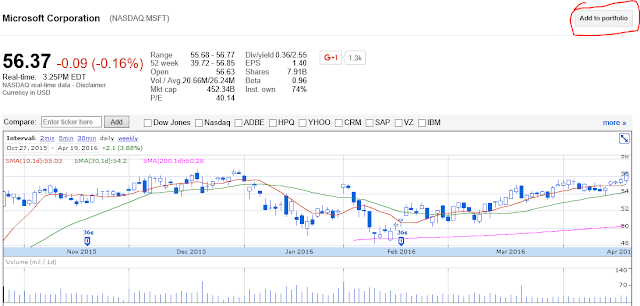
Once you click "Add to portfolio" shown in screen shot above, you will get the screen shown below. From here, you can manually add symbols or bring up a stock summary in Google Finance to add stocks to your portfolio.

To add manually put the symbol you want in the box and click the + sign Add transaction data. Or, from stock summary screen below click Add to portfolio

Fill in the information in the transaction section asked for in the screen shot below. It is not necessary to add a commision but I like to do so as it gets calculated in actual gain/loss and helps me account for them when I trade real money. Important, don't forget to check the box for "Deduct from cash" Since you can't automatically enter stop orders you should make a note as to where you would stop out if stock drops and if it happens, click the "Add transaction" and enter in a sell order.

Check "Deduct from cash"

There you go, your very own Paper Money trading platform. Hope you enjoy it.
This only deals with creating the paper money portfolio and may leave many new investors with a lot of questions on what should I buy, how many shares should I buy, when should I buy or when should I sell. All great questions that you should continue to learn about.

Friday, February 26, 2016

Market Forecast for Friday Feb 26th

David Settle from Invest tools gives a daily market forecast at the end of each day.  He is quite good at explaining why the market is doing what it is doing and suggests how he thinks it might react on the next trading day.


Market Forecast for end of trading Feb 26th

Saturday, January 23, 2016

Market Forecast - 01/22/2016 - David Settle


Good perspective on current market volatility.  30 minute listen

David uses a proprietary tool called Market Forecast that is available on TD Ameritrade charts as a lower study.  After listening to a few of his daily market forecasts you can pick up on how to use the tool as a leading indicator.
Google+